After attending the State of the Map (SOTMUS) conference last week, I started working on a project I had been thinking about for some time. I'd been particularly interested in figuring out how to use TileMill to style or override data coming from OpenStreetMap. Beyond that, I've been trying to figure out how all the different components would fit together. I should note that I'm not a cartographer, I'm just into mapping and the technology.
The Setup
We decided to move from Google Maps to OpenStreetMap about a year ago. The data was better in OSM and certainly easier to fix if we found data inaccuracies. The problem is that the default stack I was using in Drupal (OpenLayers 2.0) had layers for several default OSM map types that I couldn't style or override in any way.
The Problem
The problem is that OSM shows too much data. As a university map, we don't want to be showing the unofficial bike path called "No Brakes" or even all of the unofficial footpaths. We also don't want to step on the toes of mappers who have dedicated countless hours to improving the data. Other types of problems include having some mappers give full names to locations. Thus, you start seeing labels in close proximity that read, "University of California Santa Cruz, ___". Good semantically for the data, but not so good for visitors who are tyring to navigate a 2600 acre reserach university set in the redwoods. So, we wanted to figure out how to preserve the work of mappers, but style it to meet our purposes.
I had played with TileMill a few times over the past year. I mastered the basic tutorials, but using the app still hadn't clicked yet. As a former fanboy of Development Seed, I'd been following their work as they migrated away from Drupal to new businesses. I took a chance on getting some hands on training in the pre-conference workshops at SOTMUS 2013 and picked up enough to grok the basics.
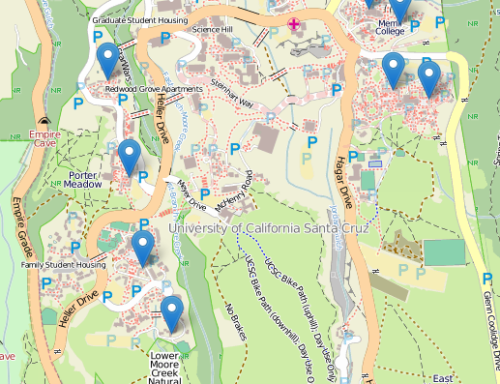
The screen shot above is using OSM and the Leaflet library via Drupal. You can see that the campus is pretty well documented in OSM.
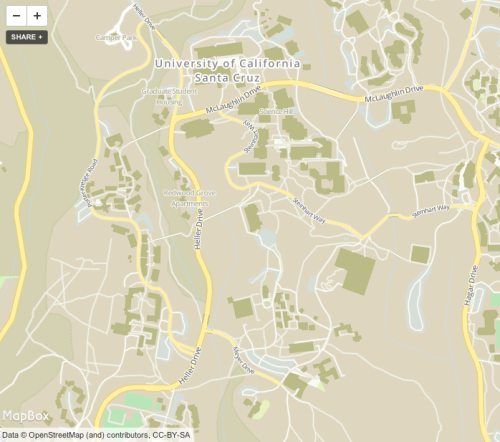
Here's a draft that has been styled using TileMill, uploaded to MapBox and displayed via Drupal using the module Leaflet Mapbox and being served up via Pantheon. What you'll notice here is that I've been able to select a basic palette, style some of the secondary and tertiary roads, hide the labels for meadows and reserves. You can see it live here: http://dev-mobilemaps.gotpantheon.com/leaflet-mapbox
Challenges
Figuring out the MapBox and OSM ecosystems is a bit of a challenge for the uniniated. MapBox is a hosting and development toolset for creating maps. MapBox makes an application called TileMill ("a web app disguised as an app" @springmeyer). TileMill files can be exported or uploaded to the MapBox service and be used in several ways (embedded, mobile app, static).
On the Drupal side, my initial issue was finding a module to work with MapBox. It makes sense that the MapBox module would work. It didn't. But, I was already using the Leaflet and Leaflet More Maps modules. I found the Leaflet MapBox module and it worked by just adding my map layer code.
MapBox is acting as a tile server where by Drupal sends a request for the map and it gets returned. There's a fee involved, but it's pretty modest. I wasn't sure what I need, so I got the $5/month account that I'll work with to determine how many map views we'd need to account for when we buy an official account. This is similar to how we got started with Pantheon and Drupal hosting; I experimented in the free version until we sized our requirements, then we bought an account.
Probably the biggest challenge for a newbie is figuring out the data schema of OSM. I'm putting together some notes on that in another article, OSM data and TileMill. The TileMill tutorial, OSM Bright Mac OS X Quickstart provides all the basics of configuring PostgreSQL, postgis in a local development stack. This allows us to use TileMill to preview the data and figure out where and how different OSM elements are named.
What's Next
What I've styled so far is pretty boring. Now that I know how to control portions of the map via the Carto language, we can develop a color palette that reflects some of the objectives we want to achieve (highlighting parking and transportation).
What's exciting is that we can now start to think about developing other maps that are styled for particular functions. That might be a walking and biking map or a bus/shuttle map (with OSM routes provided by creating relations) or a historical map or whatever else we might come up with. Your suggestions are welcome.
I've also got some ideas on how TileMill could be used in Instruction and Research. The visualization of data sets on maps has lots of potential use in many subject areas. I'm hoping I can create enough simple examples that I can get my colleagues interested in working with the academic divisions to do some TileMill training.